12 Jul 2018
DXY Technical Analysis: upside stalled just ahead of the 95.00 handle. Hourly support aligns at 94.65.
- The index is clinging to its daily gains, looking to extend the rally for the fourth consecutive session despite meeting a tough resistance in the 95.00 neighbourhood.
- DXY left behind the critical hourly high at 94.45 and moved higher to the boundaries of the key barrier at the 95.00 handle.
- Daily support comes in at the 94.65 area, coincident with the 21-day sma and the hourly low.
DXY 15M chart
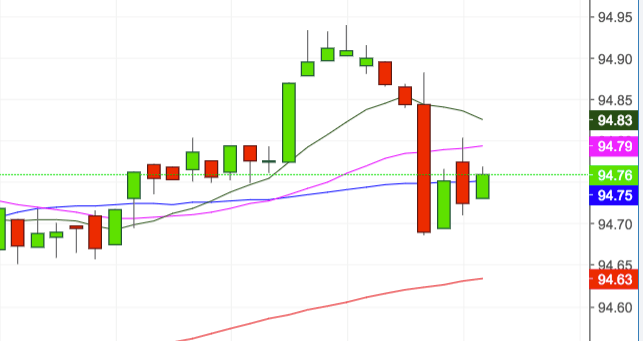
Daily high: 94.94
Daily low: 94.65
Support Levels
S1: 94.65 hourly low July 12
S2: 93.91 55-day SMA
S3: 93.71 low July 9
Resistance Levels
R1: 94.95 hourly/weekly high July 12
R2: 95.20 200-week SMA
R3: 95.53 2018 high June 28