20 Aug 2018
Crude Oil WTI Technical Analysis: Triangle compression can drive WTI to $67.70 a barrel
- Crude oil bull trend has been in consolidation mode since July, 3.
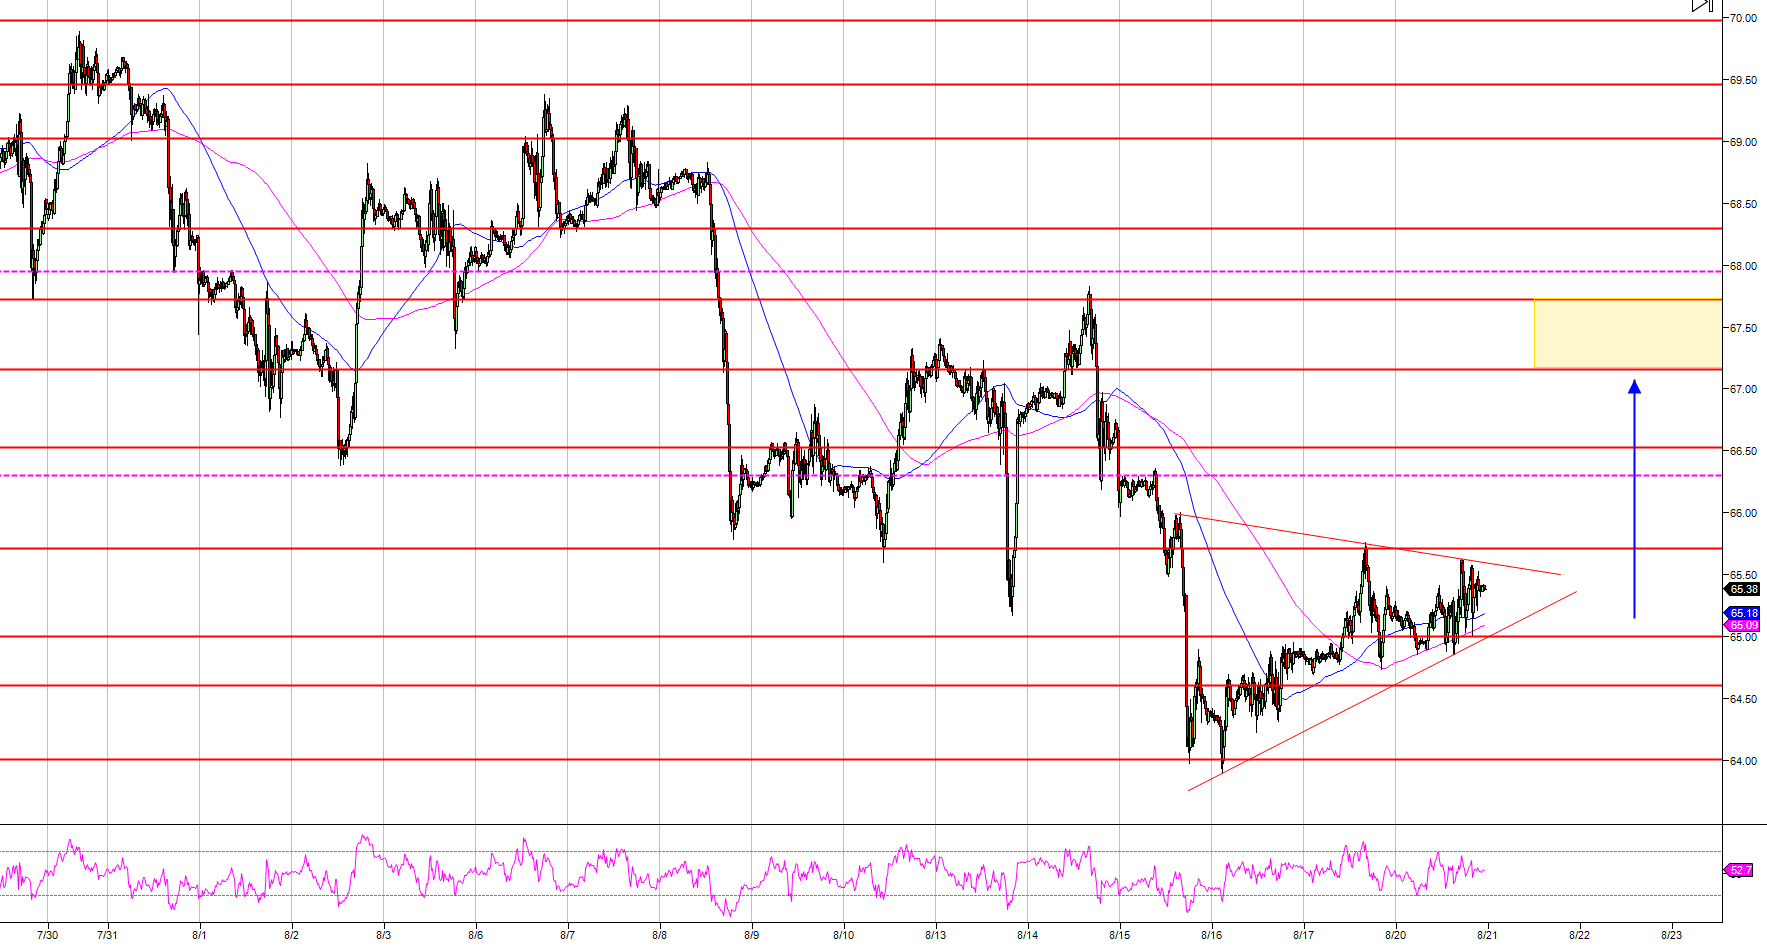
- Crude oil is forming a triangle compression pattern with the 100-period simple moving average crossing above the 200-period simple moving average suggesting a bullish bias. Targets are located near 67.16 and 67.72 levels.
- A sustained bear breakout below 64.60 could negate the bullish bias.
Crude oil WTI 15-minute chart
Spot rate: 66.41
Relative change: 0.87%
High: 66.65
Low: 65.56
Main Trend: Bullish
Resistance 1: 65.71, June 22 low
Resistance 2: 66.30-66.53 July 18 swing low and June 20 high
Resistance 3: 67.16 June 14 high
Resistance 4: 67.72 June 26 low
Resistance 5: 67.95 swing high
Support 1: 64.60 May 28 low
Support 2: 64.00 figure
Support 3: 63.63 June 11 low
Support 4: 62.40 June 18 low