USD/JPY Technical Analysis: Bulls trying to regain control, eyeing a move beyond 100/200-hour SMA
• The pair built on its steady recovery move from over two-week lows and has now climbed to fresh session tops, further beyond the 111.00 handle on the back of upbeat US monthly jobs report.
• The up-move is likely to confront stiff resistance at a confluence region, comprising of 100/200-hour SMAs and 61.8% Fibonacci retracement level of the decline over the past 24-hours.
• Beyond the mentioned cluster lies a previous ascending trend-line support break-point, now turned resistance, which if cleared should act as a key trigger for bullish traders.
USD/JPY 1-hourly chart
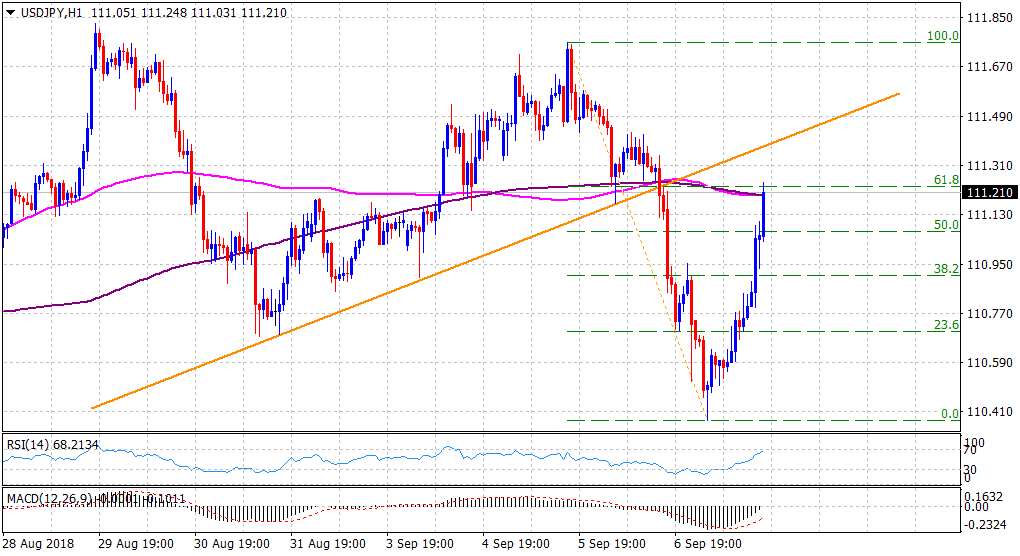
Spot Rate: 111.21
Daily Low: 110.38
Trend: Turning bullish again
Resistance
R1: 111.37 (ascending trend-line support turned resistance)
R2: 111.76 (overnight swing high)
R3: 112.00 (round figure mark)
Support
S1: 111.00 (50% Fibo. level)
S2: 110.62 (horizontal zone)
S3: 110.33 (S1 daily pivot-point)