12 Aug 2019
USD/CHF technical analysis: Greenback under pressure below 0.9700 as sellers challenge June lows
- CHF is up as Wall Street indices start the week in the red.
- The level to beat for bears are at the 0.9675 and 0.9660 levels.
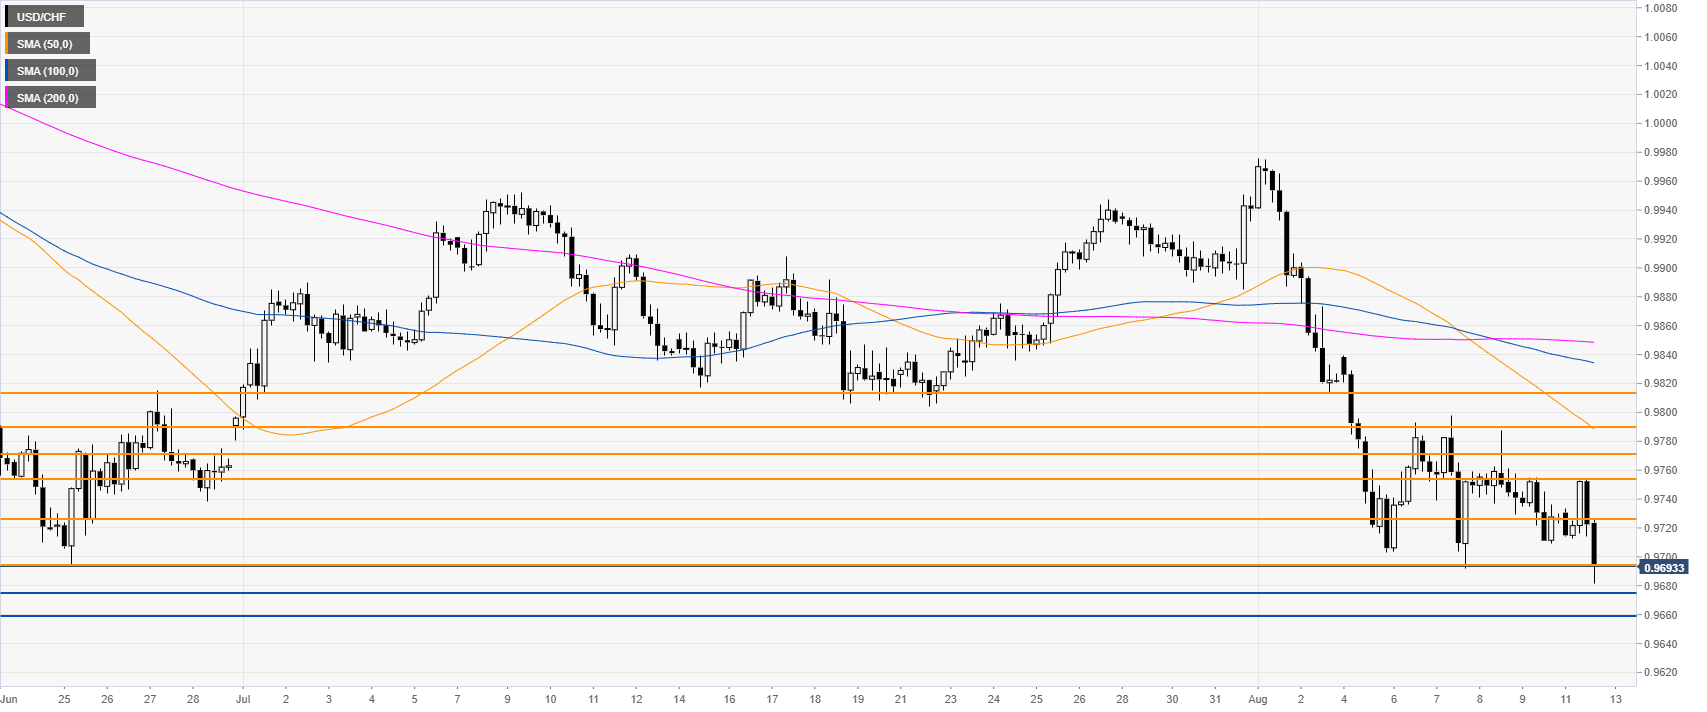
USD/CHF daily chart
USD/CHF is trading near 2-month lows below the main daily simple moving averages (DSMAs). US equity markets are starting the week on the back foot, driving demand for safe-haven currencies such as the Swiss franc.
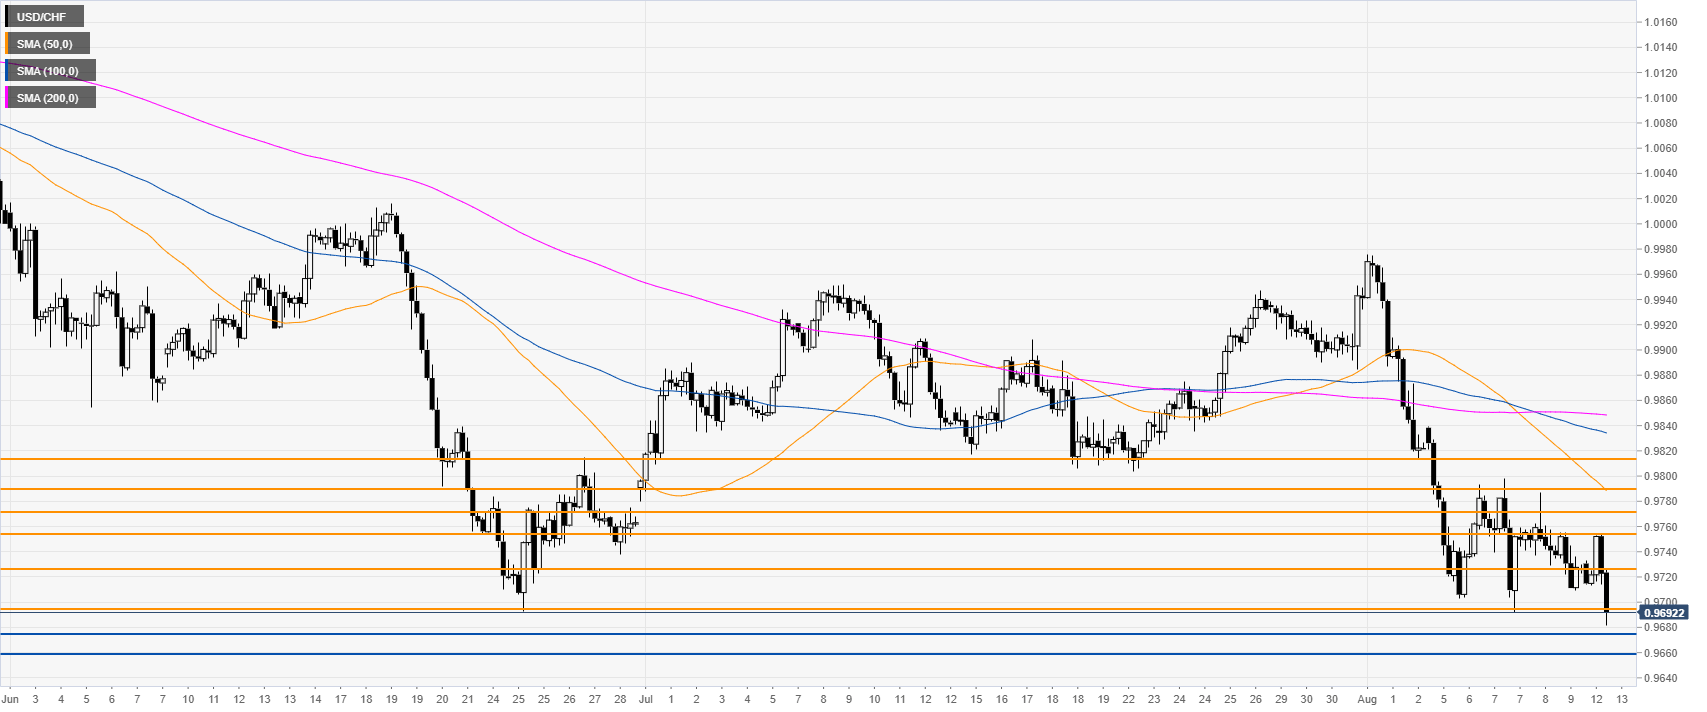
USD/CHF 4-hour chart
USD/CHF is creeping lower while trading below its main SMAs. Bears want to reach 0.9675 and 0.9660 on the way down, according to the Technical Confluences Indicator.
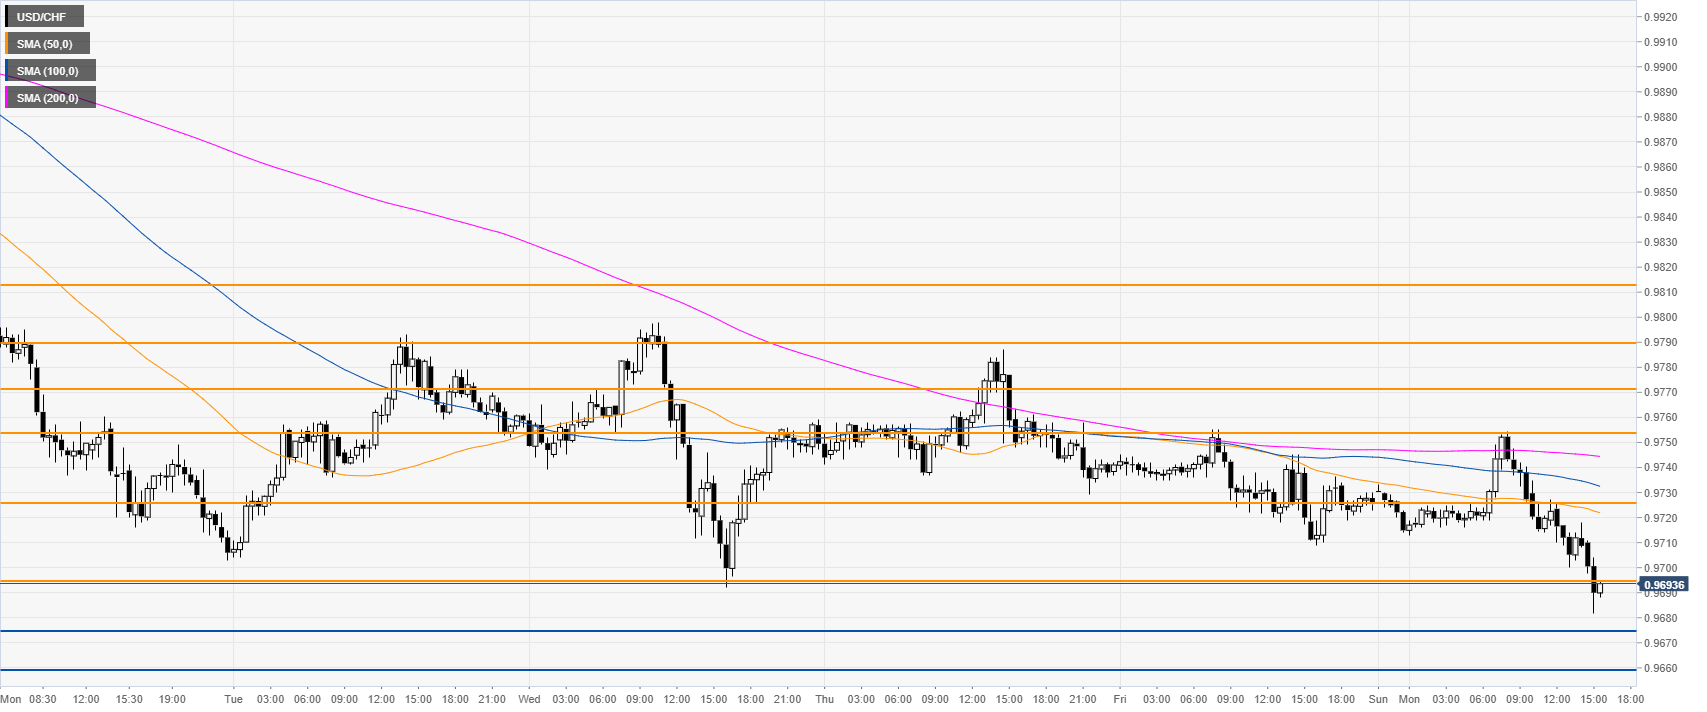
USD/CHF 30-minute chart
USD/CHF is trading below its main SMAs, suggesting bearish pressure in the near term. Immediate resistances are near 0.9694 and 0.9726, according to the Technical Confluences Indicator.
Additional key levels