19 Sep 2019
EUR/USD technical analysis: Fiber eases from daily high, trades below 1.1050 into the London close
- EUR/USD is erasing most of the gains made earlier in the London session.
- EUR/USD is trapped in a two-week range looking for a directional bias.
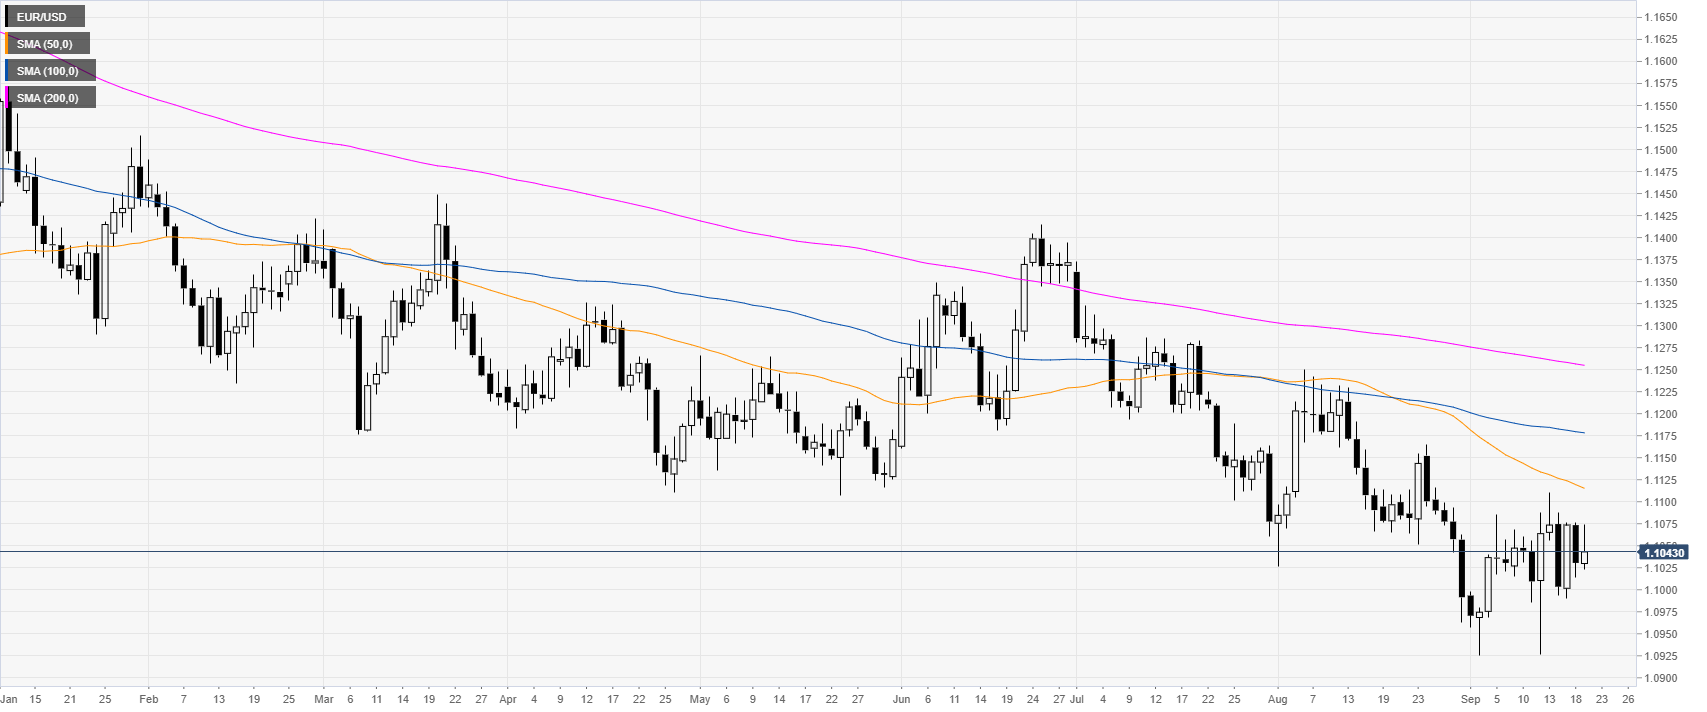
EUR/USD daily chart
The common currency, on the daily chart, is trading in a bear trend below its main daily simple moving averages (DSMAs). The Euro has been in a trading range over the last two weeks.
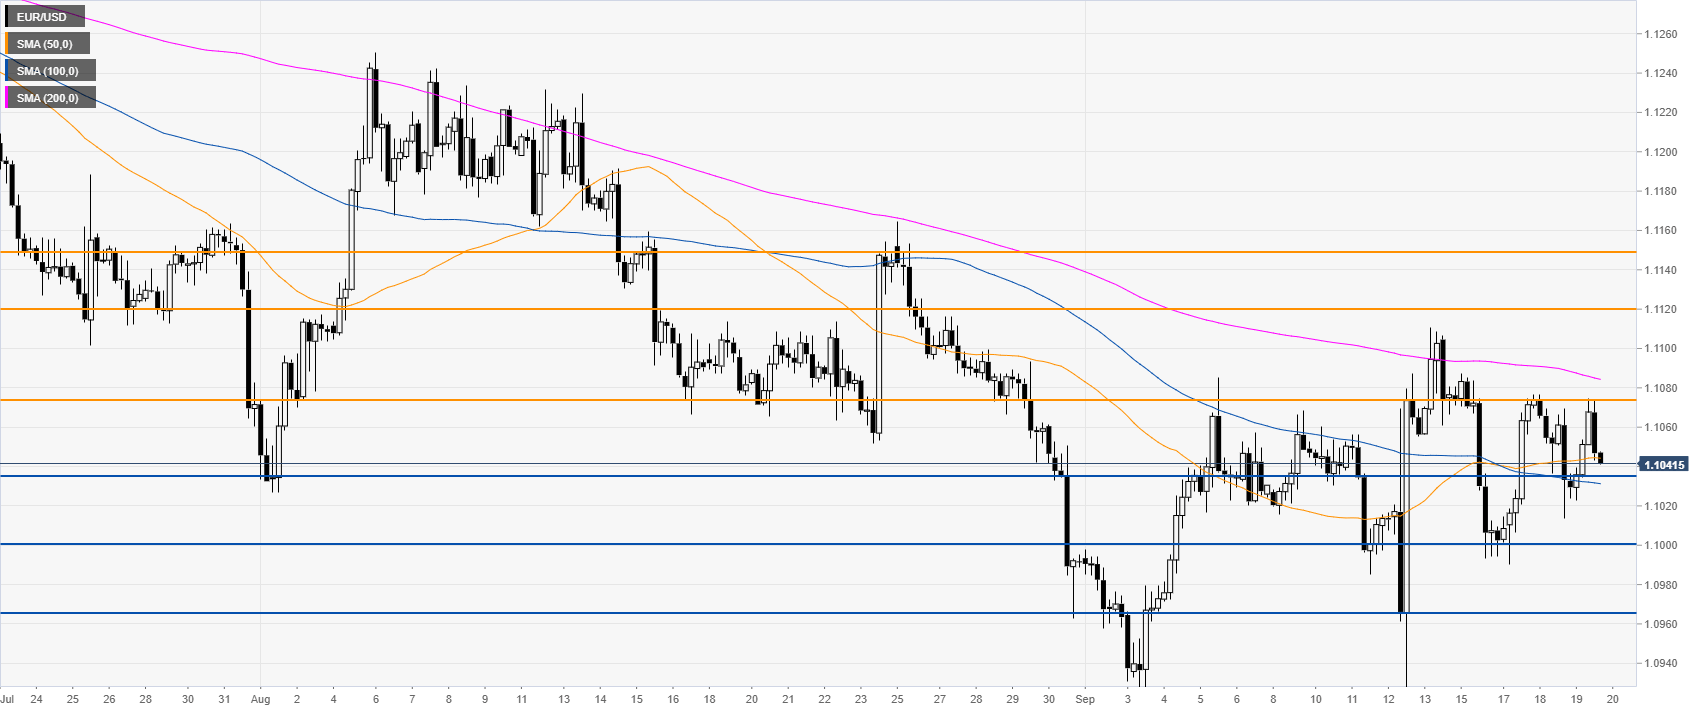
EUR/USD four-hour chart
EUR/USD is trading between the 100 and 200 SMA, suggesting a ranging market in the medium term. The spot is nearing the 1.1035 support. A break below this level is necessary for bears to reach 1.1000 and 1.0965 on the way down, according to the Technical Confluences Indicator.
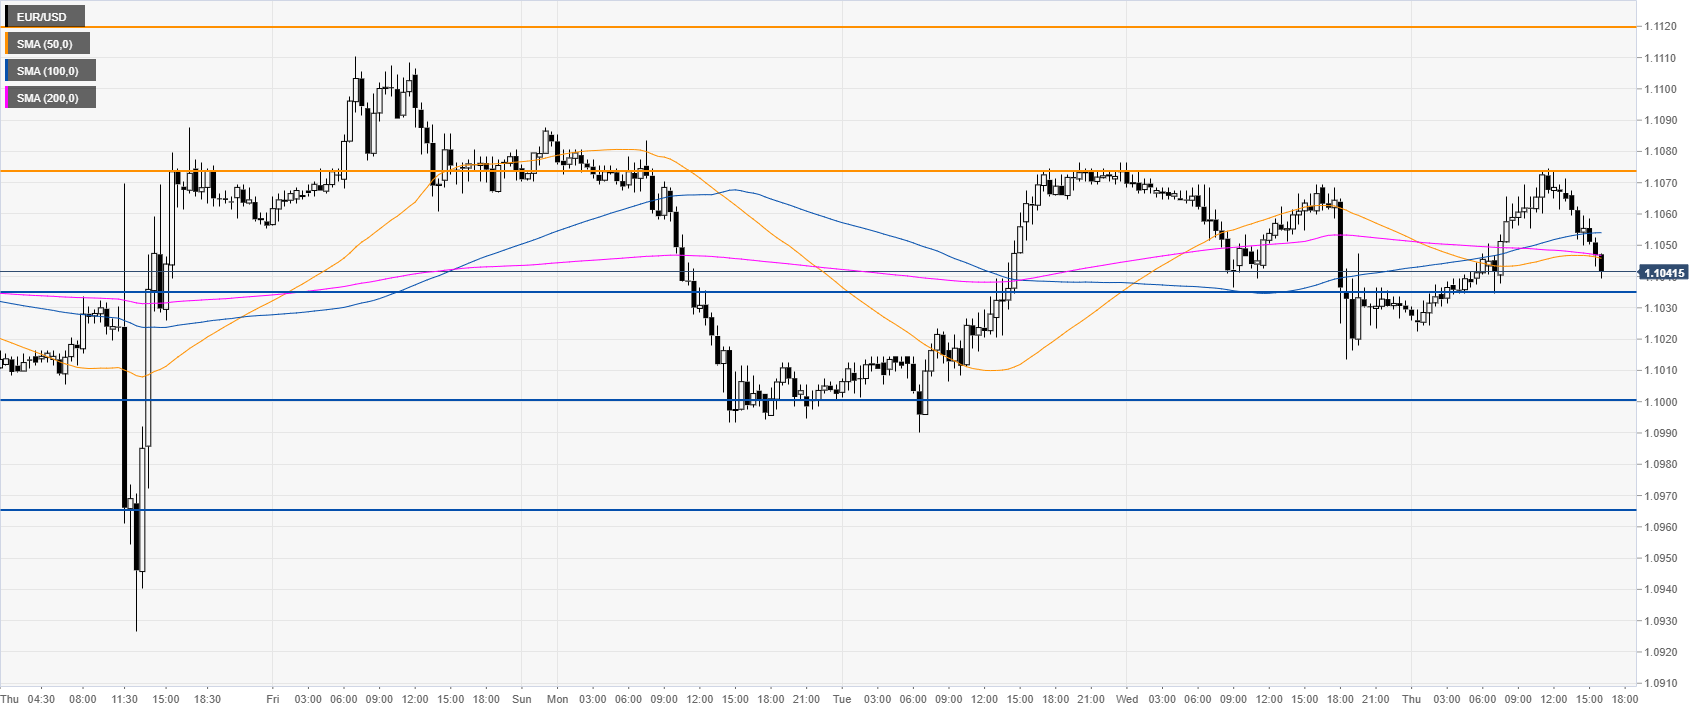
EUR/USD 30-minute chart
EUR/USD is erasing parts of the gains made earlier in the day. Resistance is seen at the 1.1074 and 1.1120 levels, according to the Technical Confluences Indicator.
Additional key levels