NZD/USD technical analysis: Bounces off 200-bar EMA, 38.2% Fibo.
- NZD/USD recovers from multi-day low amid a U-turn in oversold RSI.
- 23.6% Fibonacci retracement seems to be the immediate resistance to watch.
Having failed to slip beneath the key support confluence, NZD/USD recovers to 0.6355 during early Monday.
The quote now has to clear 23.6% Fibonacci retracement of current month upside, at 0.6385 to extend the pullback towards monthly top near 0.6440.
In a case where prices keep being strong above 0.6440, September month high of 0.6452 will be the key to follow.
On the downside, pair’s sustained declines below 0.6350/45 support-confluence including 200-bar Exponential Moving Average (EMA) and 38.2% Fibonacci retracement could recall sellers targeting 0.6320 and 0.6300 rest-points.
Though, the pair’s extended downturn beneath 0.6300 seems to pave the way for 0.6240 support.
It’s worth noting that the 14-bar Relative Strength Index (RSI) is near to oversold territory and favors the pair’s gradual recovery.
NZD/USD 4-hour chart
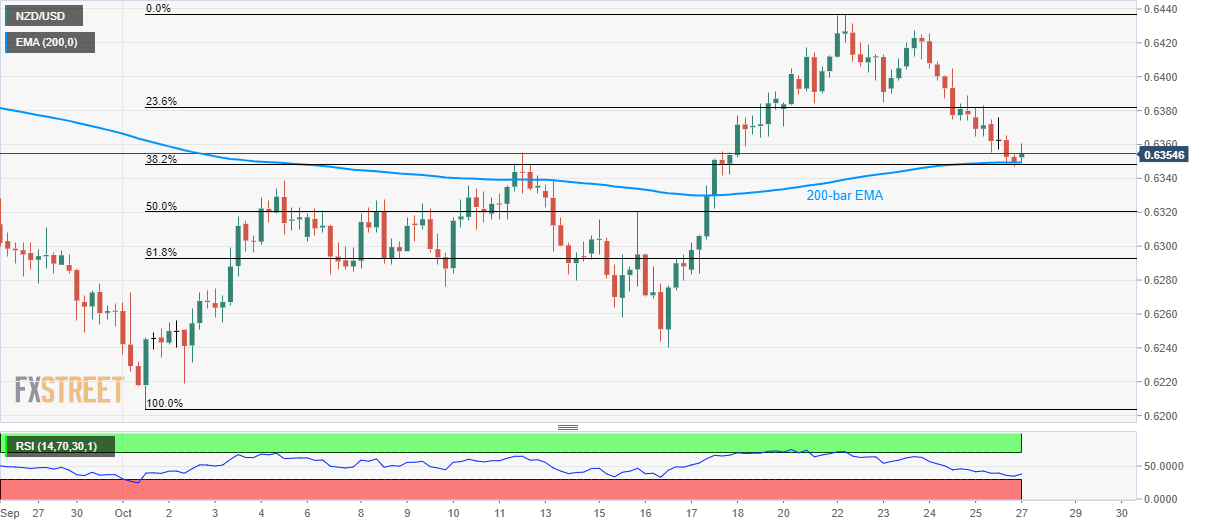
Trend: pullback expected