Silver Price Analysis: On the back foot below 10-day SMA
- Silver prices stay heavy above $23.00, keep Wednesday’s pullback from 10-day SMA.
- Downside break of 50% Fibonacci retracement again highlights 100-day SMA support.
- Early September low, one-month-old falling trend line add to the upside barriers.
Silver prices decline to $23.25 during Thursday’s Asian session. The white metal took a U-turn from 10-day SMA the previous day while closing below 50% Fibonacci retracement level of its June-August upside.
Hence, sellers are currently eyeing a downside break of the $23.00 threshold to revisit the 100-day SMA level of $22.10.
However, silver bears will have a tough time past-$22.10 as the $22.00 round-figure and 61.8% of Fibonacci retracement near $21.90 will challenge the metal’s further downside.
Meanwhile, an upside clearance of 10-day SMA, currently around $23.90, will need validation from $24.00 to aim for September 08 low near $25.85.
Also acting as the tough resistance is the falling trend line from September 01, at $26.08 now.
Silver daily chart
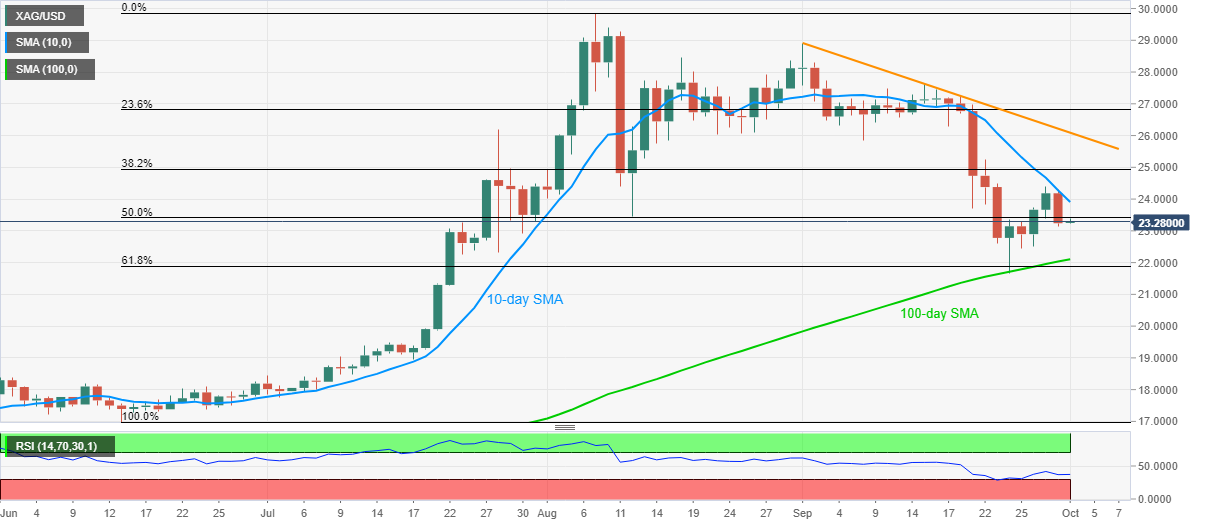
Trend: Bearish