USD/TRY Price Analysis: Rising wedge breakdown, death cross on 1H point to more losses
- USD/TRY stalls downside but not out of the woods yet.
- 1H chart spots death cross and rising wedge breakdown.
- Hourly RSI remains in the bearish region, below 50.00.
USD/TRY is consolidating its slide below all the major hourly moving average (HMA), as the bears gather pace for the next push lower.
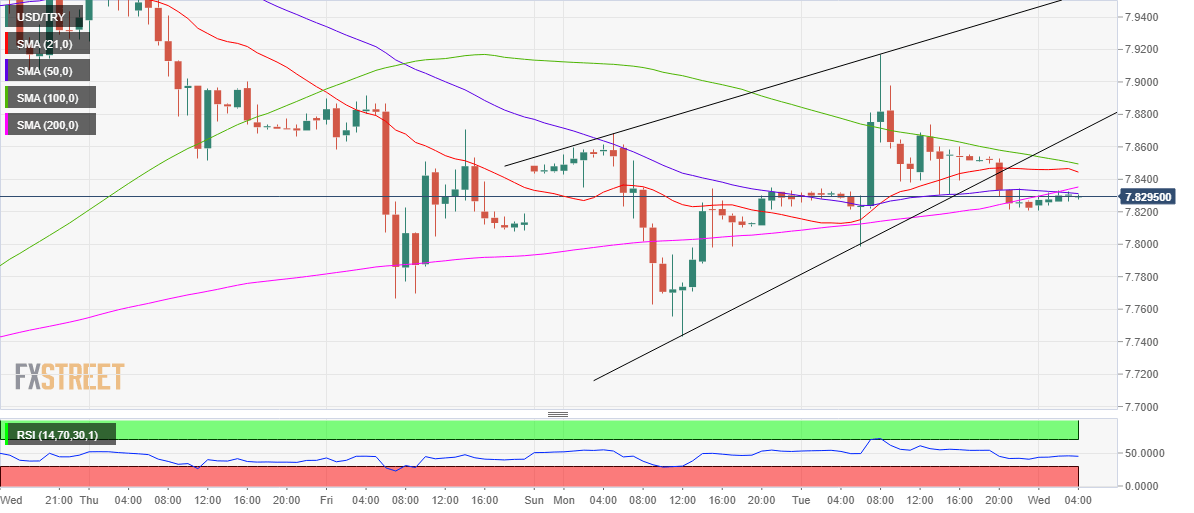
The price charted a rising wedge breakdown on the hourly chart in the late-American trading and fell as low as $7.82 before recovering slightly to $7.8350, where it now wavers.
Despite the pause in the sell-off, the risks remain skewed to the downside, as the price confirmed a death cross in the last hour. The death cross is a bearish crossover, with the 50-HMA cutting the 200-HMA from above.
The Relative Strength Index (RSI) remains flat below the midline, allowing more room for declines. Therefore, the sellers target the November 30 low of $7.7432
Alternatively, the bearish 100-HMA at 7.8500 is the level to beat for the bulls. Further up, the pattern support now resistance at $7.8690 could be challenged.
USD/TRY: Hourly chart