EUR/USD Price Analysis: 50-DMA, monthly trend line check heaviest daily jump since May
- EUR/USD seesaws around monthly high following the biggest daily rise in five months.
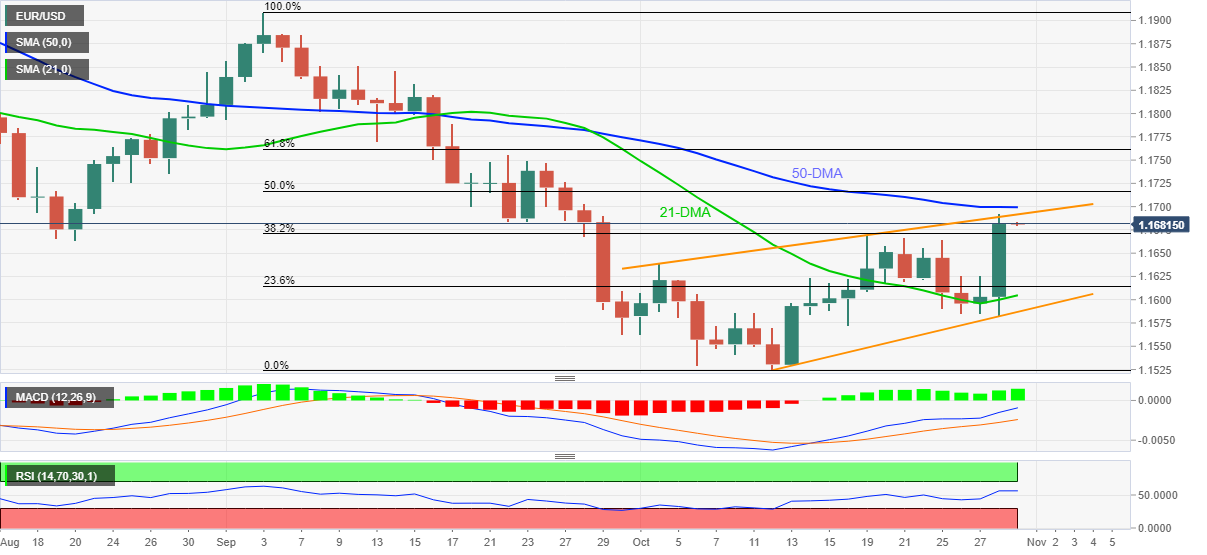
- Bullish MACD, firmer RSI line keep buyers hopeful.
- Pullback moves may eye October 19 peak, key Fibonacci retracements can also test the bulls.
EUR/USD edges higher around one-month high, taking rounds to 1.1680 during Friday’s initial Asian session. The major currency pair jumped the most since early May the previous day and refreshed the monthly peak.
However, an upward sloping trend line from October 04 questioned the quote’s further upside before the 50-DMA hurdle that’s standing nearby.
Given the bullish MACD signals and the firmer RSI line, now overbought, the EUR/USD upside is likely to prevail. Though, a clear break of the stated resistance line and DMA, respectively around 1.1690 and 1.1700, becomes necessary to rule out chances of a pullback.
Following that, 50% and 61.8% Fibonacci retracement levels of September-October fall, near 1.1720 and 1.1760 in that order will question the EUR/USD bulls.
Meanwhile, pullback moves may test the previous high of the current month, around 1.1670, a break of which will recall the 1.1630 support to the chart.
It should be noted, however, that the 21-DMA at 1.1600 and an ascending support line from October 12 close to 1.1585 become tough challenges for EUR/USD sellers to tackle before retaking the controls.
EUR/USD: Daily chart
Trend: Pullback expected