GBP/JPY Price Analysis: Head-and-shoulder chart pattern eyes 161.00
- The GBP/JPY snapped two days of losses and erased Wednesday’s gains on Thursday.
- In the near term, the GBP/JPY hourly chart formed a head-and-shoulders chart pattern, targeting 161.00.
On Thursday, the GBP/JPY finished the session in the red after hitting a daily high at 163.24 but tumbled towards the 162.10s region due to a shift in sentiment. As the Asian Pacific session begins, the GBP/JPY edges slightly up, trading at 162.10 at the time of writing.
Wall Street closed Thursday’s session in the green, erasing earlier losses. Asian equity futures are mixed, while in the FX space, the British pound is the laggard, while the yen position is slightly better than its British counterpart.
GBP/JPY Price Analysis: Technical outlook
Reviewing the daily chart, the GBP/JPY is still neutral-biased. On Thursday, the GBP/JPY failure to decisively break above the 100-day EMA exacerbated a fall from above 163.00s to current price levels, meaning sellers regained control.
If GBP/JPY sellers decisively break below August’s 18 low at 161.68, that could pave the way for further downside. On the flip side, a break above the 20-day EMA at 162.65 could send the pair rallying towards the 100-day EMA at 163.69.
Zooming into the one-hour scale, the GBP/JPY formed a head-and-shoulders chart pattern, meaning further downside pressure is expected. Nevertheless, a break above 162,37 would negate the chart pattern.
The GBP/JPY first support would be the 100-hour EMA at 161.96. A breach of the latter will expose the August 17 low at 161.68, followed by the S1 daily pivot at 161,41, before hitting the head-and-shoulders pattern at 161.00.
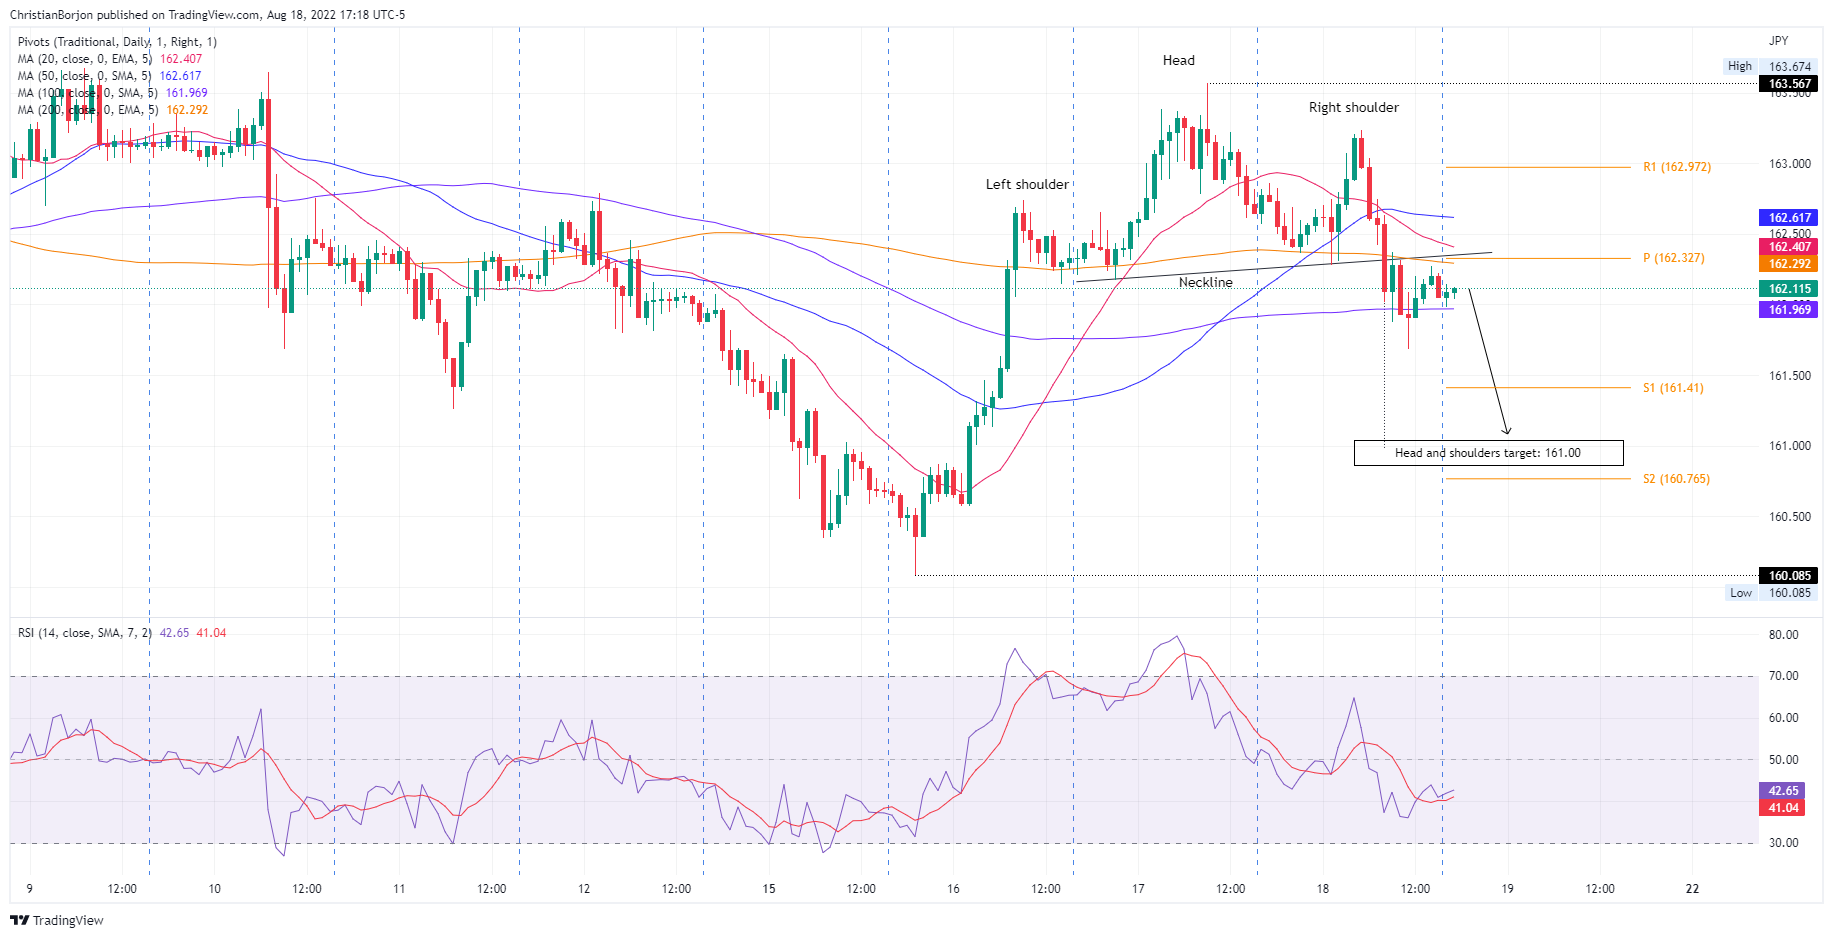
GBP/JPY Hourly chart
GBP/JPY Key Technical Levels