USD/JPY Price Analysis: Bears back on the prowl, eyes on 135.50 still
- USD/JPY weekly W-formation is a reversion pattern (the lower time frame H4 Gartley), which leaves a bearish tendency on the charts.
- The neckline of the formation opens risk to a move below 38.2% and towards the 50% mean reversion point near 134.70.
As per the prior analysis, USD/JPY Price Analysis: Bears are stepping on the gas and a move to 135.50 could be on the cards, the bears stepped in and remain in charge while below critical resistance as per the following analysis:
USD/JPY H4 chart
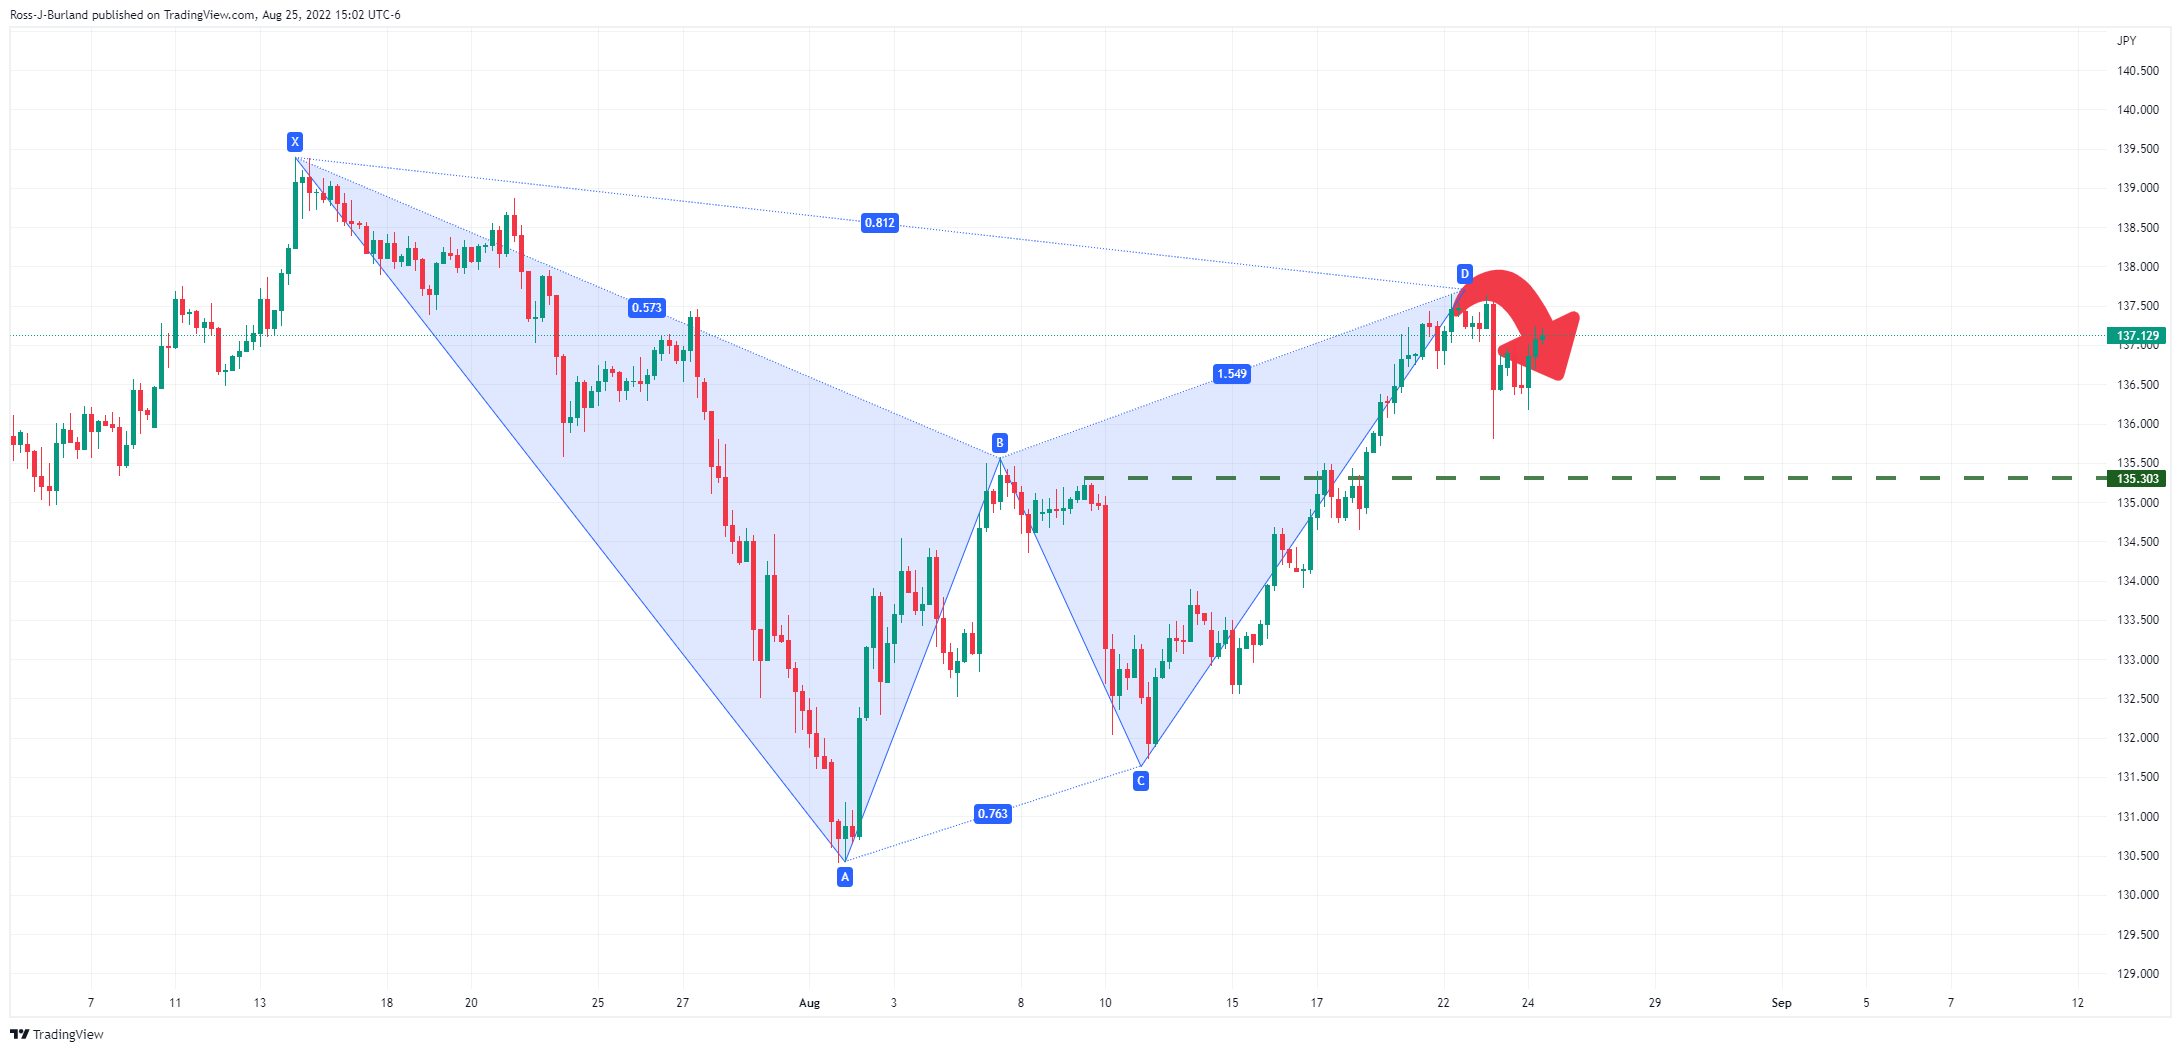
The Gartley is a reversion pattern that predicts that the price will reverse from point D. The price, in this instance, is finding resistance and could be above to make a significant move to the downside as follows:
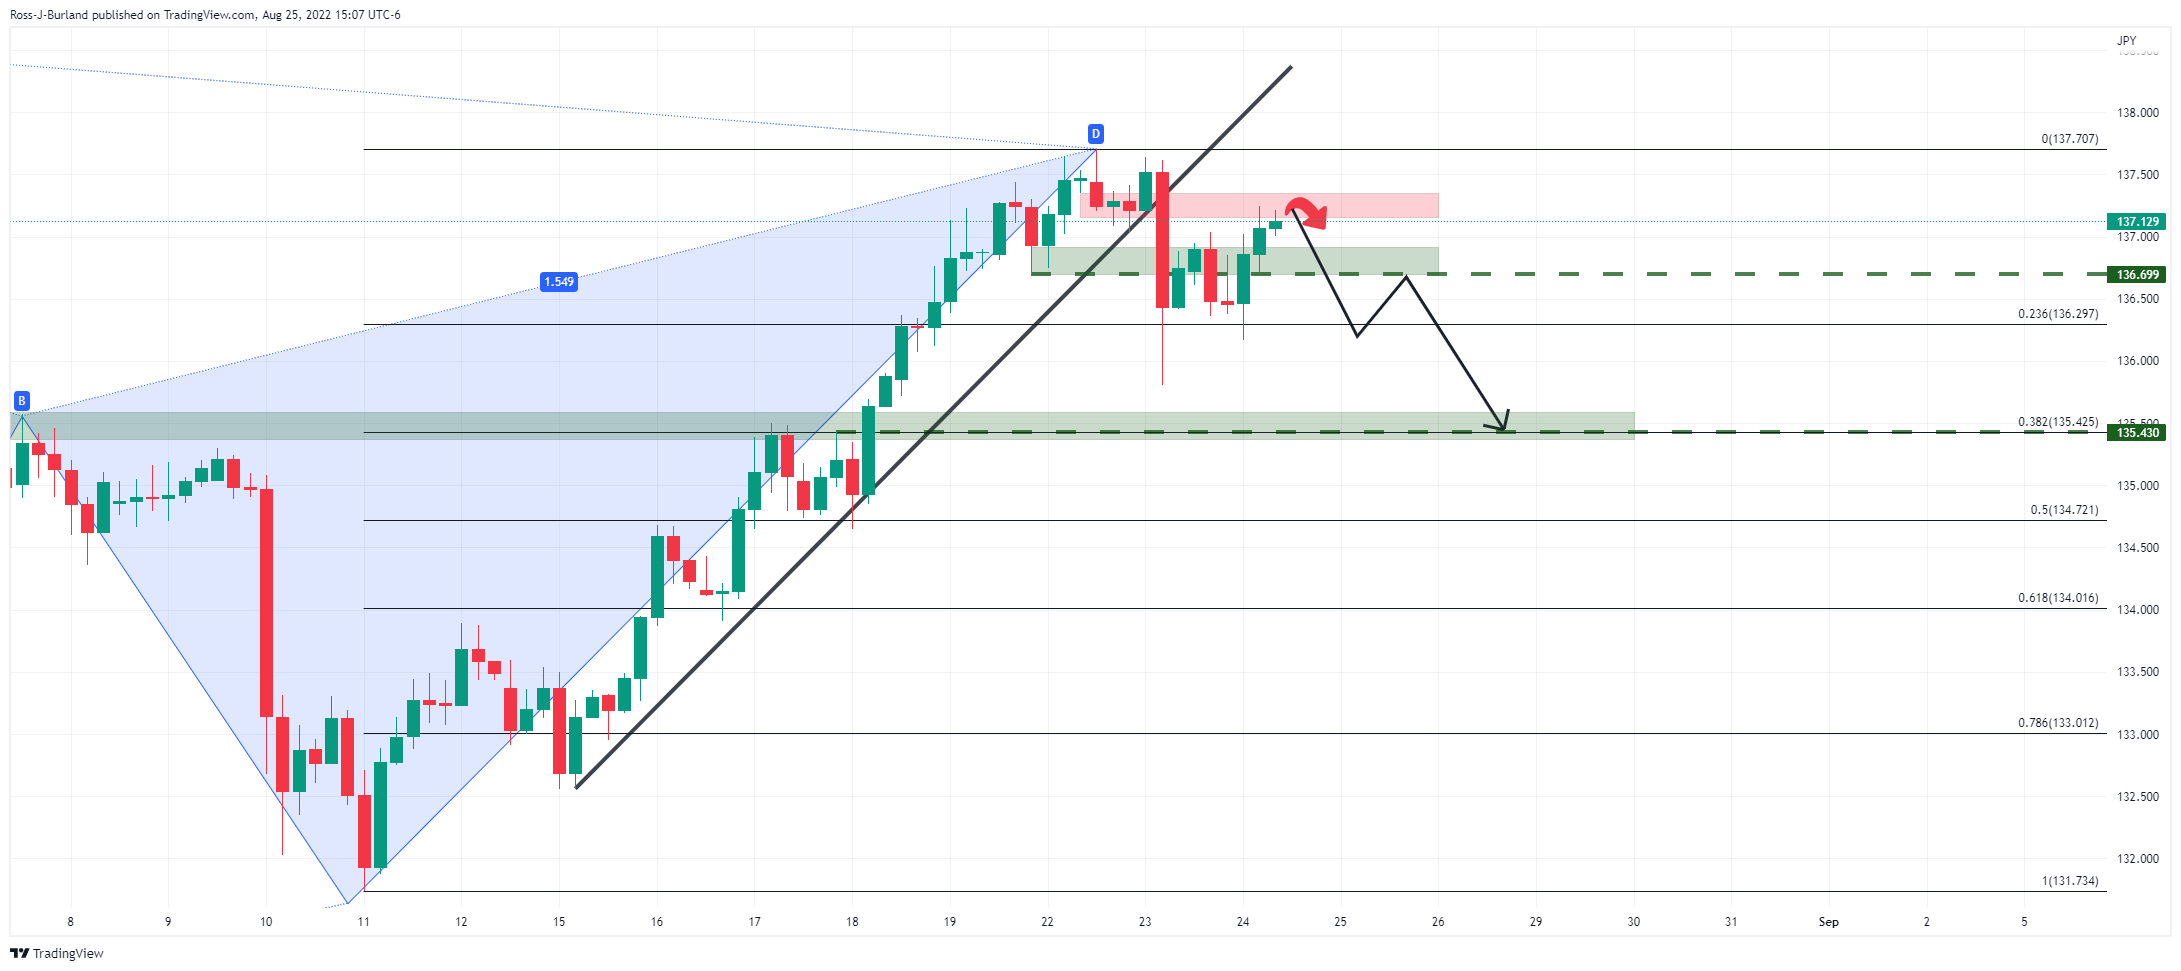
The price has met the resistance of an M-formation and is now decelerating there with sights on a move to test the W-formation's neckline near 136.70. A break of that will open prospects of a move to test the recent lows of the last bullish leg around 136.20 that is guarding the 38.2% Fibonacci level of the weekly bullish impulse near 135.50:
USD/JPY weekly chart
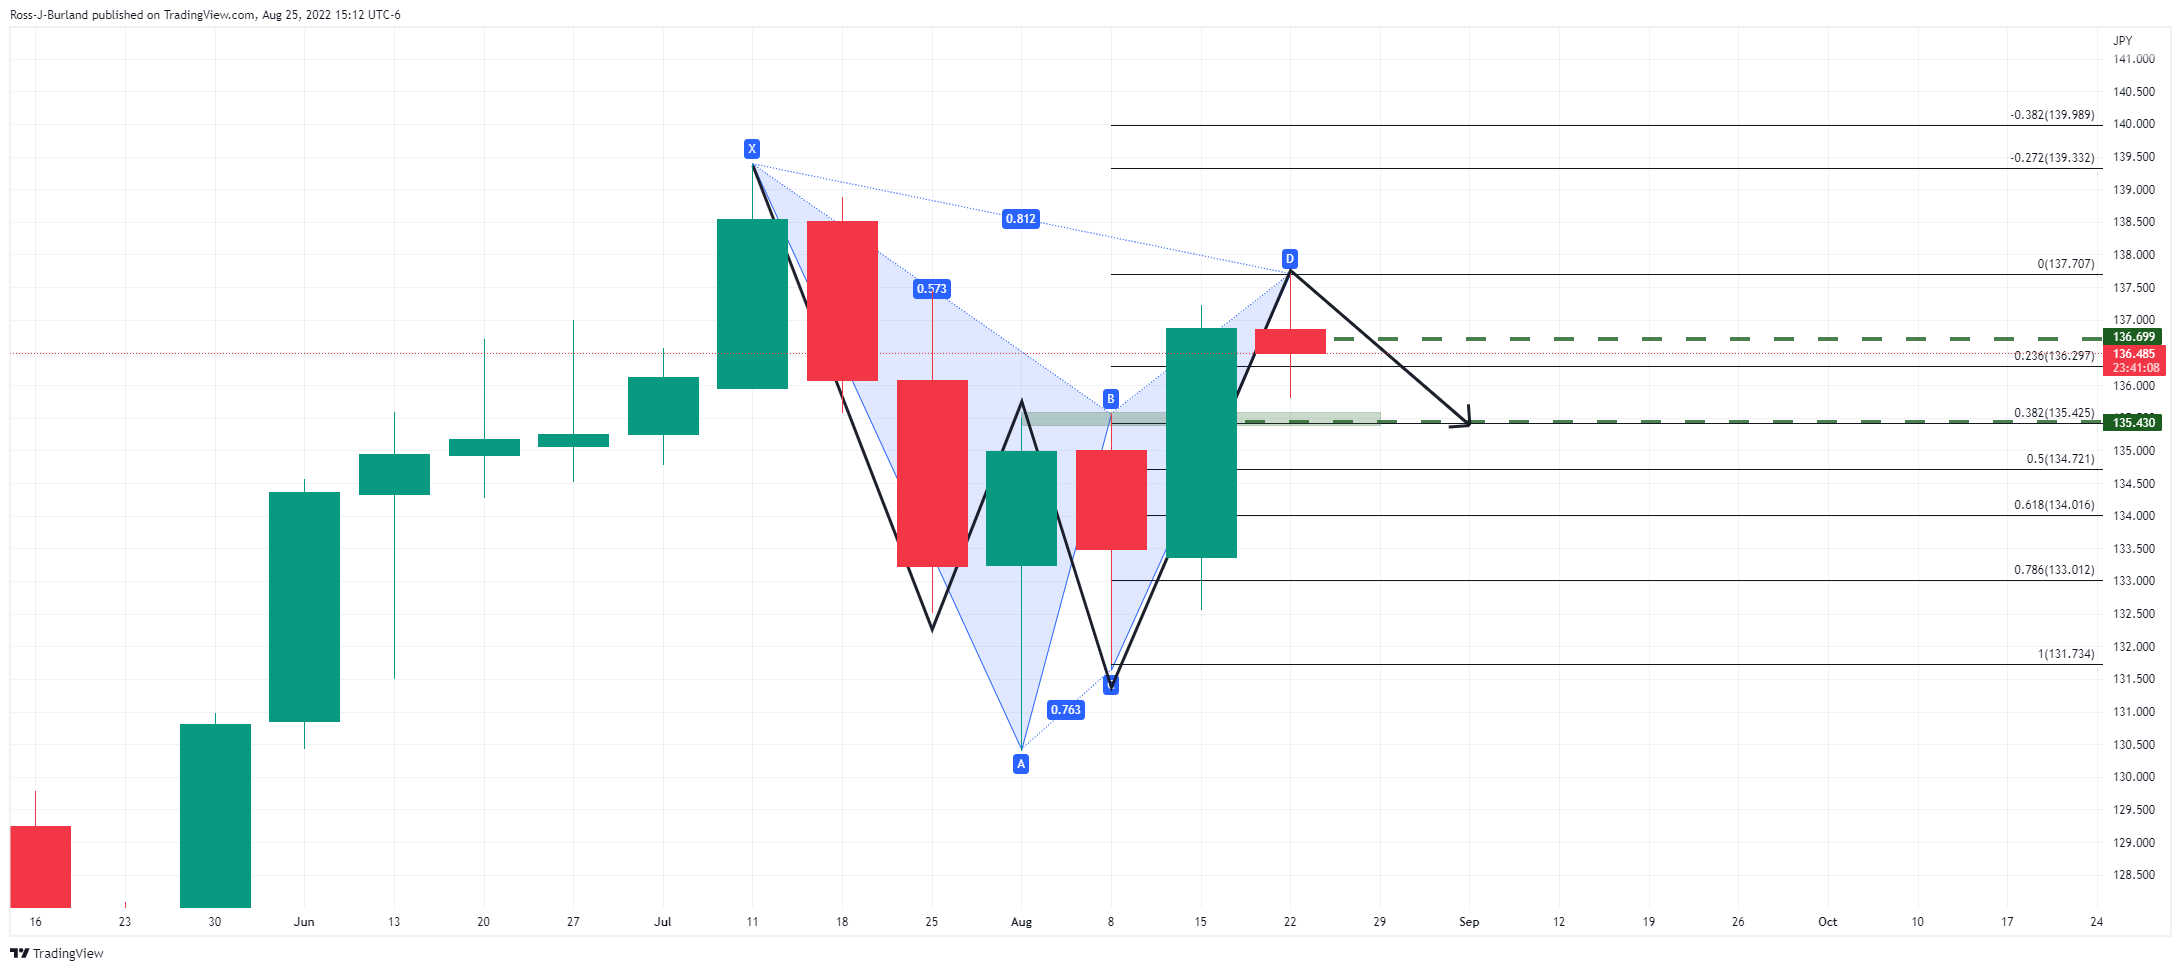
The weekly W-formation is a reversion pattern (the lower time frame H4 Gartley). The neckline of the formation opens risk to a move below 38.2% and towards the 50% mean reversion point near 134.70. This makes 135 a compelling round-figure target for the week ahead.